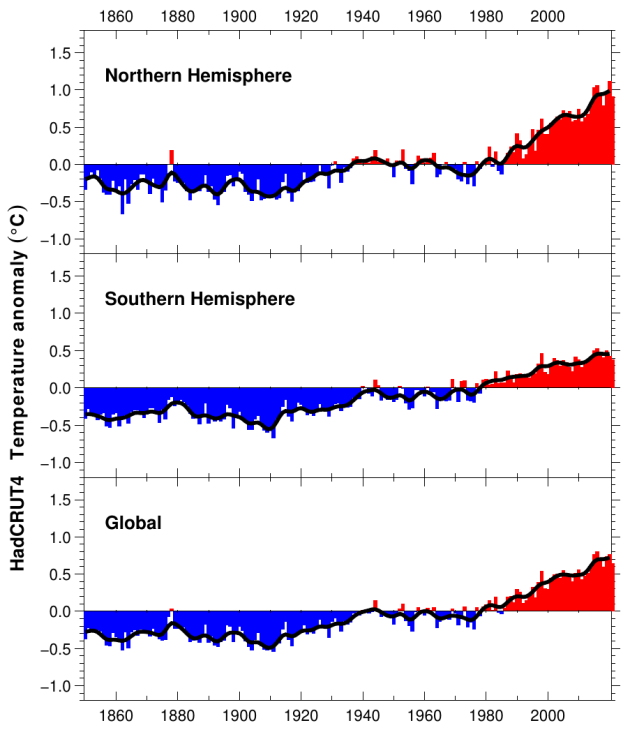
Hemispheric and global average temperature time series. Based on the HadCRUT4 global temperature dataset which combines land [CRUTEM4 dataset] and marine [HadSST3 dataset] temperature anomalies on a 5° by 5° grid. Source: Climatic Research Unit (CRU).
Image and caption from climae4you.com. “Mean annual surface air temperature (MAAT) anomaly 70-90oN compared to the WMO normal period 1961-1990, as estimated by Hadley CRUT. HadCRUT4 temperature data from the Climatic Research Unit (CRU) has been used to prepare the diagram. The number of high latitude meteorological stations is low in the early part of the 20th century, but increased from 1923 and especially 1933.”
Image and caption from climae4you.com. “Mean annual surface air temperature (MAAT) anomaly 70-90oS compared to the WMO normal period 1961-1990, as estimated by Hadley CRUT. The international geophysical year 1957 marks the initiation of widespread meteorological observations in the Antarctic. HadCRUT4 temperature data from the Climatic Research Unit (CRU) has been used to prepare the diagram.”